VWAP is one division: the total value traded divided by the total volume traded. The arithmetic is short enough to do by hand, and the real work sits upstream of it, in deciding which trades belong in the sum and what window they are drawn from. Get those two decisions wrong and the division still works; it just answers a different question.
What is VWAP? covers what the number means. This one covers how it is produced.
The formula
VWAP = (Sum of Price × Volume for every trade) / (Sum of Volume)
Price times volume is the value traded on that trade: the dollars that changed hands. Add the value traded across every trade in the period, add the volume across the same trades, and divide the first total by the second.
The unit of account is the individual trade. Every trade enters the sum once, at its own executed price, carrying its own volume. The formula has no concept of a day, an opening price or a closing price. A day is only a convenient place to draw a subtotal, and drawing it changes nothing.
A worked example
Six trades in a stock over two trading days.
| Trade | Day | Price | Volume | Value Traded (Price × Volume) |
|---|---|---|---|---|
| 1 | Monday | $2.00 | 20,000 | $40,000 |
| 2 | Monday | $2.05 | 20,000 | $41,000 |
| 3 | Monday | $2.10 | 10,000 | $21,000 |
| 4 | Tuesday | $2.10 | 30,000 | $63,000 |
| 5 | Tuesday | $2.20 | 50,000 | $110,000 |
| 6 | Tuesday | $2.15 | 20,000 | $43,000 |
| Total | 150,000 | $318,000 |
The division:
VWAP = $318,000 / 150,000 = $2.12
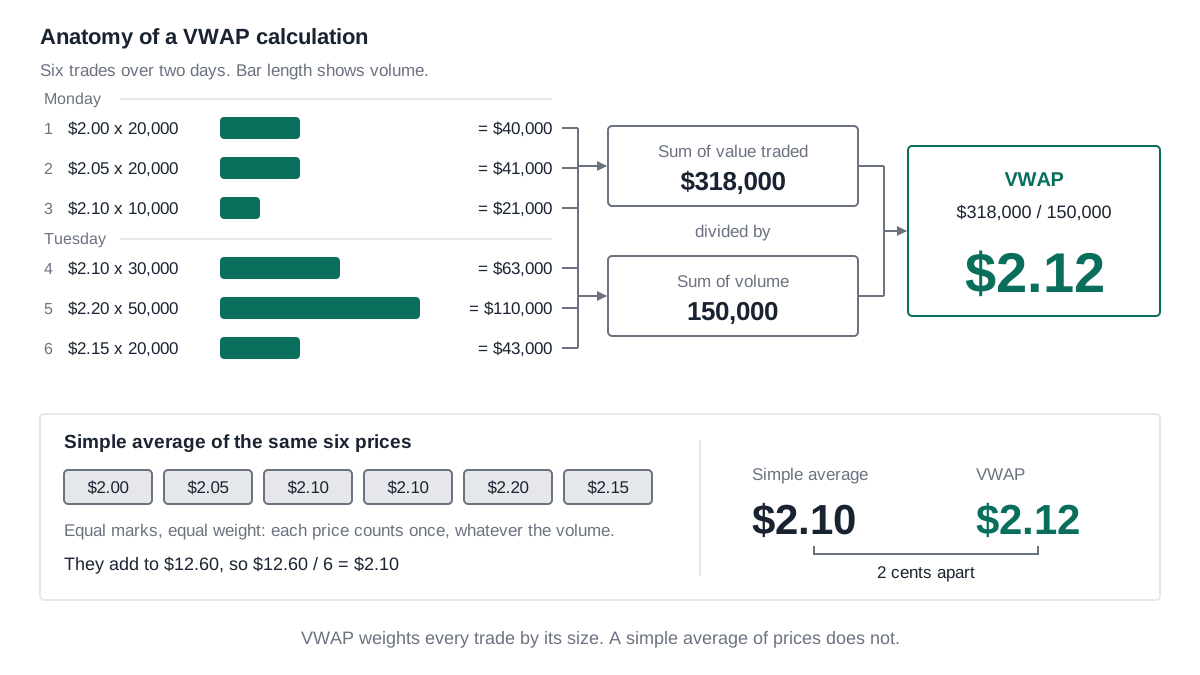
Take the two days separately and the totals split like this. Monday: 50,000 shares and $102,000 of value, a VWAP of $2.04. Tuesday: 100,000 shares and $216,000 of value, a VWAP of $2.16. Add the two pairs of subtotals back together and you are at 150,000 shares and $318,000 again, so the two-day VWAP is $2.12 either way. The day boundary is invisible to the sum. What is not safe is averaging the two daily VWAPs: $2.04 and $2.16 average to $2.10, because that treats a 50,000-share day and a 100,000-share day as equals.
The simple average of the six prices lands in the same wrong place. The prices sum to $12.60, so the average price is $2.10. Both shortcuts miss the same thing: Tuesday carried twice Monday's volume, and it carried it at higher prices. Two cents on 150,000 shares is $3,000. The same two cents on a ten million share placement is $200,000.
Trade-by-trade versus approximations
An exact VWAP needs every trade, which means time and sales data: one row per executed trade, with price, volume and a timestamp. That is what the formula above consumes, and it is the only input that lets you drop individual trades that should not count.
Where trade-level data is not to hand, the usual substitute is a typical price. Take each day's high, low and close, average them to a single typical price for the day, then weight those daily figures by each day's volume:
Typical Price = (High + Low + Close) / 3
Approximate VWAP = (Sum of Typical Price × Daily Volume) / (Sum of Volume)
It is an approximation, not a shortcut to the same answer. It compresses a whole day of trading into one blended price and then assumes the day's volume traded at that price, which it did not. The error is a function of how a day's volume was distributed across its range: a day that opens weak and then trades most of its volume near the high will report a typical price well below what buyers actually paid. A second limitation matters just as much for ASX work. Because the method never sees an individual trade, it cannot remove the trade types the Listing Rules exclude (ASX Listing Rule 19.12), so it silently keeps them in.
The calculator behind this project runs both paths: a daily typical-price mode for quick estimates, and a trade-by-trade mode for anything that has to stand up. They will not generally produce the same number over the same underlying trading, and where they differ the difference is a methodology gap rather than a data error.
The window matters as much as the arithmetic
A VWAP is only defined once you say over what period. Three things have to be settled before any arithmetic starts.
Trading days, not calendar days. A five-day VWAP means five trading days. ASX determines which days those are and notifies market participants; weekends are out, as are New Year's Day, Good Friday, Easter Monday, Christmas Day and Boxing Day, along with any other day ASX declares and publishes is not a trading day (ASX Listing Rule 19.12). Five trading days can therefore span a week, or a good deal more of the calendar across Easter or the Christmas period. A trading day on which the stock itself did not trade is still a trading day, and it contributes nothing to either total. Whether a particular rule's window is meant to stretch past such a day to pick up five days of actual trading is a question about that rule, not about VWAP, and the answer is not always written down.
Which trading within the day. The definition strips out permitted trades during the pre-trading hours period and the post-trading hours period, and out of hours trades, and it takes the meaning of those categories from the ASIC Market Integrity Rules (Competition in Exchange Markets) 2011 rather than setting them itself (ASX Listing Rule 19.12). The effect is to point the calculation at trading in the session rather than around it, but how far that reaches is not answered by the Listing Rules wording alone. Auctions are the case in point. No exclusion names an auction, and three of the six categories turn on when a trade happens rather than what kind of trade it is, so whether the opening and closing auctions are caught depends on how those periods are drawn in the ASIC rules. Which trades count and which are excluded takes that up. The closing auction often carries a large share of a day's volume, so for a short window the answer is worth pinning down.
Where the window ends. A window of a given length still has to be anchored, and around a corporate action the anchor is usually an announcement. Whether the window runs up to the day before the announcement or includes the announcement day is the difference between measuring the price before the news and measuring it partly after, and announcement days are exactly the high-volume days that pull a VWAP hardest. The definition does not settle this. It defines the price "for a particular period" and leaves the period to whichever rule or document invokes it (ASX Listing Rule 19.12). Special cases and rule-specific windows works through the windows those rules actually set.
Which trades count
The formula treats every trade as equal in kind, but the ASX definition does not. The defined term is the volume weighted average price of trading on the ASX market and the Chi-X market over the period, excluding block trades, large portfolio trades, permitted trades during the pre-trading hours period, permitted trades during the post-trading hours period, out of hours trades and exchange traded option exercises (ASX Listing Rule 19.12). Two things follow. The trade set spans both markets rather than ASX alone, and six categories of trade have to be identified in the data and removed before the sum is run. Neither step happens by itself: raw market data arrives with every trade in it, from both markets, excluded types included. Which trades count and which are excluded covers how those categories show up in the data and how to spot them.