VWAP calculator for ASX securities: why the spreadsheet number differs
There is no calculator form on this page, and for a figure that prices a transaction there is a good reason. A VWAP over a window is one division over the whole window, not an average of daily figures, and the six trade types the ASX definition excludes (ASX Listing Rule 19.12) cannot be removed from a daily summary after the fact, because there are no individual trades in it to identify or remove. Daily data is not a lower-precision route to the same number. It is a route to a different number.
What the difference looks like
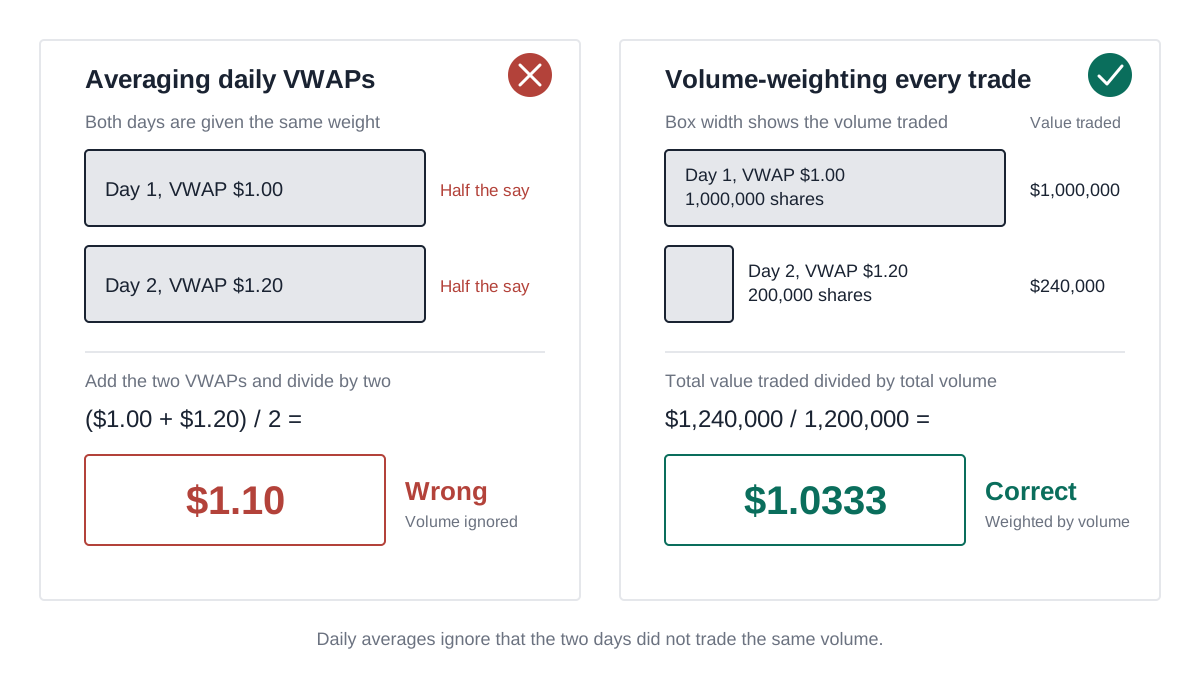
Two trading days show the size of it. Real windows are longer, 15 qualifying trading days under rule 7.1A.3 (ASX Listing Rule 7.1A.3), but two days show the mechanism without fifteen rows of arithmetic.
| Day | VWAP | Volume | Value traded |
|---|---|---|---|
| 1 | $1.00 | 1,000,000 | $1,000,000 |
| 2 | $1.20 | 200,000 | $240,000 |
| Total | 1,200,000 | $1,240,000 |
The two-day VWAP is the total value divided by the total volume: $1,240,000 / 1,200,000 = $1.0333. Average the two daily VWAPs instead and $1.00 and $1.20 average to $1.10. The gap is six and two thirds of a cent, 6.7 cents rounded, and it is not a rounding artefact. Day 2 carried one sixth of the volume and the shortcut gave it half the say.
Put that gap where it lands. A placement under the additional 10% capacity must be priced at not less than 75% of the volume weighted average market price (ASX Listing Rule 7.1A.3). Seventy-five per cent of $1.0333 is 77.5 cents. Seventy-five per cent of $1.10 is 82.5 cents. The two methods produce minimum issue prices five cents apart on the same two days of trading.
Here the shortcut reads high, which is the safer of the two directions. Swap the two volumes over, so the million shares trade at $1.20 and the 200,000 at $1.00, and the value traded becomes $1,400,000 on the same 1,200,000 shares: $1,400,000 / 1,200,000 = $1.1667. The average of the daily VWAPs is still $1.10. The floor is now 87.5 cents and the shortcut says 82.5 cents, so an issue priced at what the spreadsheet called the floor comes in five cents under the price the rule requires, and nothing in the paperwork shows it.
The spreadsheet method that does work
If each row of the table genuinely carries the day's VWAP and the day's volume, the trade-level answer is recoverable exactly. Multiply each day's VWAP by that day's volume to recover the value traded, add the values down the column, add the volumes, and divide once. On the two days above: $1.00 × 1,000,000 is $1,000,000, $1.20 × 200,000 is $240,000, and $1,240,000 / 1,200,000 = $1.0333. One division at the end, never an average of the daily column.
Two conditions have to hold for that recovery to be the rule's figure. The VWAP column and the volume column must describe the same trade set, and that trade set must already be the one the definition names: both markets in, the six excluded trade types out (ASX Listing Rule 19.12). Nothing on the face of the table says whether either condition is met, and a daily summary built from all reported trading fails the second one before the arithmetic starts.
What the rule's number needs
The example above is generous, because it assumes the daily table carries a true daily VWAP. Most do not. They carry open, high, low, close and volume, and the usual substitute is a typical price of (high + low + close) / 3 weighted by daily volume. That method compresses a whole session into one blended number built from three prices, then assumes the day's volume all traded there.
The exclusions are the harder problem. The trades the definition takes out are large by construction: block trades start at $200,000 of consideration for a Tier 3 equity market product and $1,000,000 at Tier 1, and a large portfolio trade runs to at least $5,000,000 across at least 10 classes (ASIC Market Integrity Rules (Securities Markets) 2017, rules 6.2.1 and 6.2.2), so a single one of them left in a thin stock's five-day window can move the answer on its own. A daily summary cannot be repaired, because the excluded types are already blended into the day's volume and the day's range.
The fix is time and sales data covering both markets, with price, volume, timestamp and condition codes on every row, and a documented policy for turning those codes into exclusions. Expect the exclusion set applied in practice to be wider than the six named categories, because real data carries trade types the rule never contemplated, and record that as a judgement rather than as the rule speaking.
Quoting a figure someone can check
Quote a VWAP with four things attached: the exact first and last dates of the window, the venue basis, the exclusion policy including anything removed beyond the six named categories, and the source. A number carrying those can be re-derived by anyone who disagrees with it. A figure quoted bare can only be believed, which is a poor position to be in when a placement price is built on it.
What the report includes
- The figure and the window
The volume weighted average market price for the security, with the first and last dates of the period it covers and the number of days in it.
- Methodology stated against the rule
The calculation is prepared to the ASX Listing Rule 19.12 definition of volume weighted average market price, from trade-level data rather than a daily price table.
- What the report sets out
A daily breakdown of volume, value and VWAP with the period low, high, opening and closing price, the complete trade-level data set behind the calculation, and a record of any excluded trades.
- The excluded trade types removed
Block trades, large portfolio trades, permitted trades during the pre-trading and post-trading hours periods, out of hours trades and exchange traded option exercises are taken out before the sum is run (ASX Listing Rule 19.12).
- Workings anyone can redo
Every row of the trade-level list carries its timestamp, price, volume and the running turnover, so anyone who disagrees with the figure can redo the arithmetic from the same data.
- PDF report and Excel spreadsheet
A written report plus a spreadsheet carrying the input data and the calculation steps.
Every regulatory statement on this page names the rule or guidance note it comes from, and every report states the window, the markets counted, the trade types removed and the source of the data. Reports are prepared by Riverstone Corporate Pty Ltd T/AS VWAP.com.au, ABN 42 883 208 403, West Leederville, Western Australia.
Price and delivery
Report delivered within 24 hours. Price includes GST.
Report delivered within 3 hours. Price includes GST.
Order multiple reports in a single transaction and each additional report uses the same pricing.
Common questions
Can I calculate a VWAP in a spreadsheet?
You can, and done properly it reproduces the trade-level answer exactly: one weighted division over the whole window, worked through in the method section above, never an average of the daily column. The catch is that the two columns have to describe the same trade set, with the excluded trade types already out, and nothing on the face of the table tells you which you have.
Can I average the daily VWAP column?
No. A VWAP over a window is one division over the whole window, not an average of averages. Averaging daily figures gives each day an equal vote, which is an assertion that every day traded the same volume, and the days that break the assumption hardest are the ones around announcements.
Why is my VWAP different from someone else's?
A VWAP is not a property of a security. It is a property of a security plus four choices: the window, the venue set, the exclusion policy and the source of the data. Change any one and the figure changes, and none of the four is visible on the face of the result, which is why two careful people can produce different numbers and both be right.
What data does a rule-standard calculation need?
Time and sales data covering both markets, with price, volume, timestamp and condition codes on every row, and a documented policy for turning those codes into exclusions. Confirm the condition-code column is actually present before trusting a clean-looking result, because an export without one will look tidy and be wrong.
Is there an online VWAP calculator on this page?
No. A figure that prices a transaction under the Listing Rules is produced from trade-level data with an exclusion policy applied and the basis written down, not from a form on a web page. We prepare that calculation as a report: $99 delivered within 24 hours, or $149 within 3 hours.