Very few wrong VWAPs are wrong because someone mistyped the division. They are wrong because of a decision taken before the division: what data went in, which days, which trades, which markets, and what was written down afterwards. Six recurring errors account for most of it.
How VWAP is calculated covers the arithmetic, which trades count and which are excluded covers the trades and multi-venue trading covers the markets. This guide is about what goes wrong, and it points back to those three rather than arguing the same ground twice.
Building a multi-day VWAP out of daily figures
Someone needs a five-day or 15-day VWAP. What they have is a table with one row per day, so they average the daily numbers and hand the result over.
The pull is obvious. Daily data is cheap, quick to get and already in a spreadsheet, while trade-level data usually has to be requested. A table with a VWAP column looks like exactly the input the job calls for, and averaging a column is what a spreadsheet is for. The word "average" sitting inside "volume weighted average market price" does the rest.
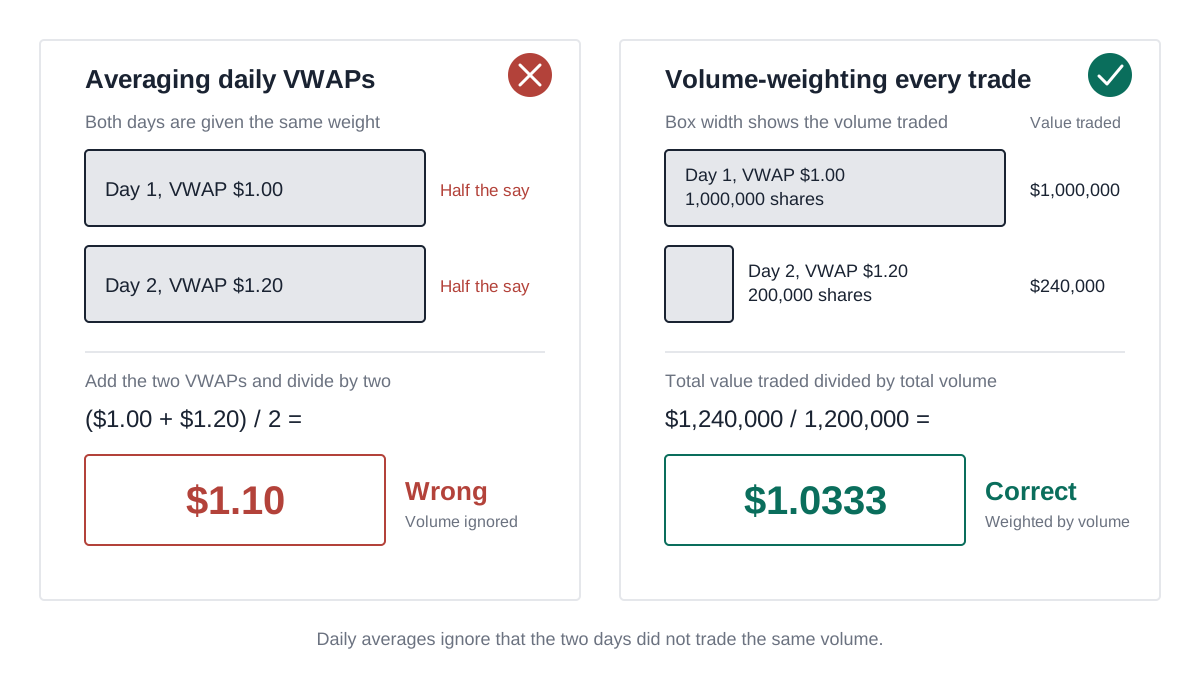
It is still the wrong operation. A VWAP over a window is one division over the whole window, not an average of averages. Averaging daily figures gives each day an equal vote, which is an assertion that every day traded the same volume. Days rarely do, and the days that break the assumption hardest are the ones around announcements.
Two trading days show the size of it. Real windows are longer, 15 qualifying trading days under rule 7.1A.3 (ASX Listing Rule 7.1A.3), but two days show the mechanism without fifteen rows of arithmetic.
| Day | VWAP | Volume | Value Traded |
|---|---|---|---|
| 1 | $1.00 | 1,000,000 | $1,000,000 |
| 2 | $1.20 | 200,000 | $240,000 |
| Total | 1,200,000 | $1,240,000 |
The two-day VWAP is the total value divided by the total volume:
VWAP = $1,240,000 / 1,200,000 = $1.0333
The exact figure is thirty-one thirtieths of a dollar, $1.0333 to four decimal places. Now average the two daily VWAPs instead: $1.00 and $1.20 average to $1.10. The gap is six and two thirds of a cent, 6.7 cents rounded, and it is not a rounding artefact. Day 2 carried one sixth of the volume and the shortcut gave it half the say.
Put that gap where it lands. A placement under the additional 10% capacity must be priced at not less than 75% of the volume weighted average market price (ASX Listing Rule 7.1A.3). Seventy-five per cent of $1.0333 is 77.5 cents. Seventy-five per cent of $1.10 is 82.5 cents. The two methods produce minimum issue prices five cents apart on the same two days of trading.
Here the shortcut reads high, which is the safer of the two directions, because an issue priced against an overstated floor still clears the real one. Swap the two volumes over, so the million shares trade at $1.20 and the 200,000 at $1.00, and the value traded becomes $1,400,000 on the same 1,200,000 shares:
VWAP = $1,400,000 / 1,200,000 = $1.1667
The average of the daily VWAPs is still $1.10. Same six and two thirds of a cent, other way round. The floor is now 87.5 cents and the shortcut says 82.5 cents, so an issue priced at what the spreadsheet called the floor comes in five cents under the price the rule requires, and nothing in the paperwork shows it.
The example above is generous, because it assumes the daily table carries a true daily VWAP. Most do not. They carry open, high, low, close and volume, and the usual substitute is a typical price of (high + low + close) / 3 weighted by daily volume, which how VWAP is calculated sets out. That method fixes the day weighting and puts a different error in its place: it compresses a whole session into one blended number built from three prices, then assumes the day's volume all traded there. A day that opens weak and does most of its business near the high reports a typical price below what buyers paid, and the further a day's volume sits from the middle of its range, the further the number drifts.
The two errors are separate, which is what makes the combination worth watching. Volume-weighting the daily typical prices removes the first and leaves the second. Averaging daily typical prices without weighting them leaves both in, and nothing makes them cancel: on a window where the heavy days also traded high in their range, both push the same way.
If you genuinely hold each day's VWAP and each day's volume, weight by volume. Multiply each day's VWAP by that day's volume to recover the value traded, add the values, add the volumes, divide once. That reproduces the trade-level answer exactly, because the day boundary is invisible to the sum (how VWAP is calculated). The catch is that the two columns have to describe the same trade set. A daily VWAP computed on one exclusion policy sitting next to a volume figure computed on another reconstructs nothing, and nothing on the face of the table tells you which you have.
For a figure that has to stand up under the Listing Rules, use trade-level data. The arithmetic does not demand it. The next mistake does.
Leaving the excluded trade types in
The sum gets run over every row in the file.
This one is close to the default outcome rather than an act of carelessness. The excluded types do not announce themselves; raw market data arrives with everything in it. And the exclusion is not written in the rule anyone was reading. LR 7.1A.3 says "+volume weighted average market price" (ASX Listing Rule 7.1A.3), and the six categories only appear once the plus sign is followed back to the Chapter 19 definition (ASX Listing Rule 19.12).
The trades this leaves in are large by construction. Block trades start at $200,000 of consideration for a Tier 3 equity market product and $1,000,000 at Tier 1, and a large portfolio trade runs to at least $5,000,000 across at least 10 classes (ASIC Market Integrity Rules (Securities Markets) 2017, rules 6.2.1 and 6.2.2), so a single one of them left in a thin stock's five-day window can move the answer on its own. This is not hypothetical. In this project's recalculation work, one published figure reproduced almost exactly only on a basis that is not defensible at all: the ASX-only book with two special crossings left in, which this project's exclusion policy removes as block trades. LR 19.12 names block trades and does not name special crossings, so treating those two prints as block trades is a judgement rather than the rule speaking (which trades count and which are excluded), and it is the judgement that decided the answer. Multi-venue trading sets the case out in full.
Note where this collides with the first mistake. A daily summary cannot be repaired. There are no individual trades in it to identify or remove, and the excluded types are already blended into the day's volume and the day's range, so the exclusion cannot be applied after the fact at any level of care (which trades count and which are excluded). Daily data is not a lower-precision route to the same number. It is a route to a different number.
The fix is time and sales data covering both markets, with price, volume, timestamp and condition codes on every row, and a documented policy for turning those codes into exclusions. Confirm the condition-code column is actually present before trusting a clean-looking result, because an export without one will look tidy and be wrong (which trades count and which are excluded). Expect the exclusion set you apply in practice to be wider than the six named categories, because real data carries trade types the rule never contemplated, and record it as your judgement rather than as the rule's.
Getting the window wrong
Three versions of this turn up, and they are usually found by someone else.
Calendar days instead of trading days. "Five days" gets read off a calendar. A trading day is a day ASX determines to be one and notifies to market participants, which rules out weekends, New Year's Day, Good Friday, Easter Monday, Christmas Day, Boxing Day and any other day ASX declares is not a trading day (ASX Listing Rule 19.12). Five trading days over Easter or the Christmas period can span a fortnight of calendar. Some rules then narrow the count further, to days on which trades in the class were actually recorded, which is not the same as trading days at all; why and when VWAP is used works through that counting nuance in LR 7.1A.3, and special cases takes up the separate drafting point that LR 10.12 Exception 4 says "days" where 7.1A.3 says "trading days".
Off by one at the end. A window has to be anchored, and the anchor is usually an announcement or a pricing date. Whether the window stops the day before that date or includes it is the difference between measuring the price before the news and measuring it partly after, and announcement days carry unusual volume, so the day in dispute is often one of the heaviest in the window. LR 7.1A.3 measures the days "immediately before" its anchor (ASX Listing Rule 7.1A.3), and why and when VWAP is used sets out how far that carries.
Halts and quiet days inside the window. Nothing in the trading day definition asks whether the particular security traded (ASX Listing Rule 19.12), so a day the stock spent in a trading halt is still a trading day and contributes nothing to either total. A rule that counts days on which trades were recorded steps over that day and reaches back one further. A rule that counts trading days flat does not. A spreadsheet that quietly does one where the rule requires the other will agree with the rule on every ordinary window. It parts company exactly when something unusual has happened, which is when this calculation tends to be run.
The window itself usually comes from a rule or a plan document written years before, and it is being read at speed by someone with a board meeting in the morning.
Fix the window before opening the data. Write down the two end dates, the counting basis the instrument actually uses, and how many qualifying days fall between them. If the instrument does not settle the point, record the reading taken and why. That is a five minute job before the arithmetic and a much longer one afterwards.
A corporate action inside the window
A share split, a consolidation or a bonus issue lands inside the window, and price times volume gets summed straight across it.
Fifteen trading days is long enough to contain one, and the overlap is not a coincidence: consolidations are commonly done ahead of a raise, so the consolidation and the VWAP that prices the raise end up competing for the same fortnight. Nothing in the data objects. The file has prices in it and volumes in it, the sum runs, and a plausible-looking price comes out.
What has actually happened is a change of units. A ten to one consolidation multiplies the quoted price by about ten and divides the quoted volume by about ten, so the rows on either side of the action are denominated in different things. The value traded survives, because dollars are dollars on both sides. The denominator does not: total volume is now a count of pre-consolidation shares added to a count of post-consolidation shares. The division delivers dollars divided by a mixture, and the answer sits somewhere between the two price scales while matching neither.
This is arithmetic rather than regulation. The definition fixes a method and a set of excluded trade types and says nothing about corporate actions (ASX Listing Rule 19.12), so the problem is in the data rather than in the rule. Two responses are defensible. Restate every trade onto one basis using the ratio, so that the prices and volumes on both sides of the action are expressed in the same shares, then run the single division. Or segment the window at the action, compute each side on its own basis and say plainly which basis the reported figure is on. What is not defensible is doing neither and not noticing.
Check the state of the data before choosing, because a history that has already been restated and one that has not look identical on screen. Ask the question of your source. And keep the ex-dividend case separate: the price step on an ex date is real trading in unchanged units, so nothing needs restating, though a window straddling it does blend two price levels and the VWAP will land between them.
Not saying which venues were counted
A figure gets produced, or accepted, without anyone establishing whether it spans both markets or one.
The definition prices trading on the ASX market and the second market named in it (ASX Listing Rule 19.12), so a figure built from one alone is not the defined figure. What the omission costs is a couple of cents on a two dollar share, or about one per cent of whatever is raised at that price, and multi-venue trading works that through across 400,000 shares.
Three things keep this alive. Extracts often cover one market and do not say so on their face. The second exchange has been renamed twice and the Listing Rules still call it by the oldest of the three names, so a check written against one name passes a file that uses another (multi-venue trading). And ASX's own condition code document carries a VWAP update flag that is tempting to filter on, which produces an ASX-market figure by construction because it maps ASX trade types in an ASX document (multi-venue trading).
The fix costs one question and one sentence: ask the source which markets the extract covers before the arithmetic starts, and state the basis in whatever document reports the number.
Quoting a figure nobody can check
The last one is not a calculation error at all. It is a figure quoted bare: "the VWAP was $1.0333", with no window, no venue basis, no exclusion policy and no source.
It happens because the number is what was asked for and the basis feels like working out. By the time anyone queries it, the spreadsheet has gone and the person who ran it is on another deal.
A VWAP is not a property of a security. It is a property of a security plus four choices: the window, the venue set, the exclusion policy and the source of the data. Change any one and the figure changes, and none of the four is visible on the face of the result, which is why two careful people can produce different numbers and both be right (what is VWAP?). A figure quoted without its basis therefore cannot be confirmed or contradicted. It can only be believed, which is a poor position to be in when a placement price is built on it.
On ASX, part of the answer is already required. The Appendix 3B for an issue under rule 7.1A prompts the entity to send its ASX Listings Compliance adviser a work sheet stating the pricing date, the pricing period and the VWAP for the relevant class over that period, and to identify the source of the calculation (ASX Guidance Note 21). Naming a source answers where the figure came from. It does not answer which markets that source counted or which trade types it removed, and those are the two questions a dispute turns on.
So quote a VWAP with four things attached: the exact first and last dates of the window, the venue basis, the exclusion policy including anything removed beyond the six named categories, and the source. A number carrying those can be re-derived by anyone who disagrees with it. Special cases and rule-specific windows covers the disclosure requirement and the rules that turn on a VWAP.